Recent Stories
- Businesses urged to tap into science and technology young talent
- Digital relay baton enables remote crowd cheering of athletes
- Health Innovation Campus moves a step closer
- £7.1 million R&D boost for North West businesses
- Centre of excellence created for the next industrial revolution
- Artificial intelligence toolkit spots new child sexual abuse media online
- Strategic partnership set to help plug cyber security skills gap
- What your choice of smartphone says about you
- InfoLabTree: Discover the Story
- novi.digital Launch Event - 'An Event to Help Businesses Grow Online'
RSS Feeds
RSS feeds can deliver the latest InfoLab21 news and events direct to your browser without you having to visit the website.
In most browsers you can click on an RSS link and choose to subscribe to the feed to add it to your favourites or bookmarks.
InfoLab21 Needs Your Data
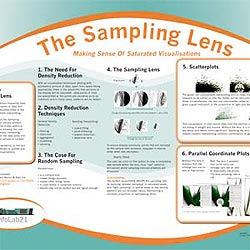
 The Sampling Lens
Researchers in the Computing department have developed a technique to help gain a better insight into visualisations of large amounts of data. They are looking for businesses to participate in a study to evaluate the effectiveness of their information visualisation application which utilises their novel sampling technique.
Ideally they would like users who regularly use interactive parallel coordinate plots or scatter plots to analyse their data and have large amounts of data that cannot normally be displayed all at once on the screen due to overplotting of the lines or points.
The tool can be used to spot correlations in data and has many potential applications, for example, spotting market trends and analysing buying behaviour.
For more information and examples of how the lens works, see:
Tue 24 October 2006


